
Influence diagrams, a powerful tool for visualizing and analyzing decision-making processes, have greatly benefited from these technological improvements. With the rise of artificial intelligence (AI), machine learning, cloud computing, and sophisticated data visualization software, influence diagrams are becoming more dynamic, accurate, and applicable across various industries. This article explores what influence diagrams are, how they are used, and how modern technology is transforming their effectiveness.
What Are Influence Diagrams?
An influence diagram is a graphical representation of a decision-making process, used to model uncertain outcomes, choices, and dependencies between different variables. It is an alternative to decision trees but presents information in a more compact and intuitive format. The key components of an influence diagram include:
- Decision nodes (represented by rectangles): These show points where decisions must be made.
- Chance nodes (ovals or circles): These represent uncertain factors or risks that affect the outcome.
- Value nodes (diamonds): These indicate the objectives or payoffs of a decision.
- Arrows: These define relationships and dependencies among different elements.
Influence diagrams are widely used in business, healthcare, engineering, and artificial intelligence to structure complex problems, assess risks, and optimize decision-making.
Traditional Use of Influence Diagrams
Before the digital revolution, influence diagrams were primarily used as static paper-based or whiteboard models, often requiring manual updates. They helped decision-makers visualize dependencies but lacked the computational power to process large data sets or predict outcomes dynamically. Their usefulness was limited by the availability of computing resources, making them more of a conceptual tool rather than an interactive decision-making aid.
With the introduction of computers and statistical modeling, influence diagrams became more advanced. Early digital tools allowed users to input probabilities and analyze possible outcomes, but these models were still relatively simplistic. Decision-makers had to rely on historical data and human intuition rather than real-time insights.
How Technology Improves the Use of Influence Diagrams
Technological advancements have significantly enhanced the use and effectiveness of influence diagrams, making them more precise, flexible, and applicable in real-world decision-making. Here are some key ways technology has improved influence diagrams:
1. AI and Machine Learning for Better Predictions
Artificial intelligence and machine learning have transformed influence diagrams into predictive models. By incorporating real-time data and learning algorithms, influence diagrams can now adjust probabilities dynamically and improve decision-making. AI-powered influence diagrams help businesses and organizations make better predictions about market trends, customer behavior, or risks in financial investments.
For example, in healthcare, AI-enhanced influence diagrams assist doctors in diagnosing diseases by analyzing patient history, symptoms, and medical research data, leading to better treatment plans.
2. Cloud Computing and Remote Collaboration
With cloud computing, influence diagrams are no longer confined to a single computer or user. Platforms such as Google Cloud, Microsoft Azure, and Amazon Web Services allow multiple stakeholders to collaborate on influence diagrams in real time. Decision-makers can now work together from different locations, inputting data and refining models simultaneously.
This is particularly beneficial in industries like logistics, where supply chain managers can update and analyze influence diagrams with live shipping data, adjusting routes and inventory levels accordingly.
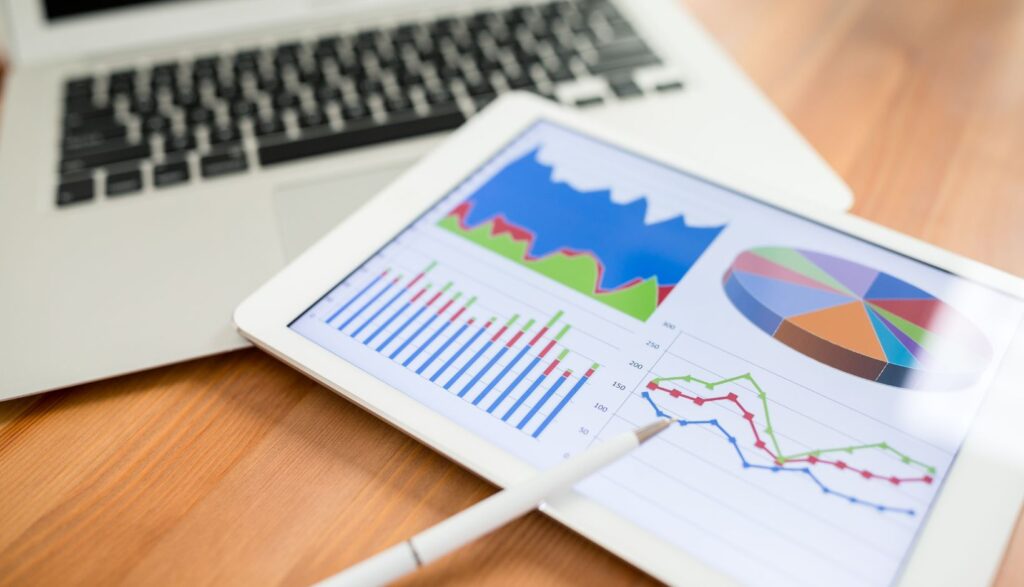
3. Advanced Data Visualization and Simulation Tools
Modern software such as Tableau, Power BI, and dedicated decision-analysis tools like Analytica and Netica have significantly improved how influence diagrams are presented and interpreted. These tools allow for:
- Interactive graphs and dynamic updates based on incoming data.
- Simulation models that test various decision scenarios before implementation.
- Integration with big data sources to incorporate broader insights into decision-making.
For example, in finance, traders can use influence diagrams linked to real-time market data to assess risk and optimize investment strategies.
4. Integration with Big Data for More Accurate Analysis
The rise of big data has given influence diagrams access to vast amounts of structured and unstructured data, improving their accuracy and depth. Decision-makers no longer need to rely on small sample sizes or outdated reports. Instead, they can use real-time analytics from sources like IoT sensors, social media trends, and transaction records.
For instance, in agriculture, farmers use influence diagrams combined with big data to analyze weather patterns, soil conditions, and crop yields, leading to more informed planting and harvesting decisions.
5. Automation and Decision Support Systems
Modern influence diagrams are now integrated into automated decision support systems (DSS). These systems not only help visualize decision problems but also recommend optimal choices based on predefined goals. Businesses use DSS with influence diagrams to streamline operations, reduce costs, and improve efficiency.
For example, an airline company can use an automated system with influence diagrams to determine the best flight schedules, pricing strategies, and maintenance plans based on customer demand and weather conditions.
The Future of Influence Diagrams with Emerging Technologies
As technology continues to evolve, influence diagrams will become even more sophisticated. Future advancements that will further enhance their use include:
- Quantum Computing: Faster and more complex data processing will allow for more precise decision modeling.
- Blockchain Technology: Secure and transparent decision-making processes, especially in finance and supply chain management.
- Augmented Reality (AR) and Virtual Reality (VR): Interactive visualization of influence diagrams in 3D environments for better understanding and engagement.
Conclusion
Influence diagrams have come a long way from static, conceptual tools to dynamic, data-driven decision-making aids. Technological advancements in AI, cloud computing, big data, and automation have significantly improved their functionality, accuracy, and real-world application. As these technologies continue to evolve, influence diagrams will become even more powerful, shaping the way individuals and organizations make critical decisions. Whether in business, healthcare, finance, or engineering, modern influence diagrams are proving to be indispensable tools for navigating today’s complex world.